
Drive through an unfamiliar neighborhood, and you can probably tell at a glance whether it votes Democrat or Republican just based on the numbers of sedans versus trucks parked along the street.
That sounds like an assumption based purely on stereotypes about wealthy Democrats and rural, truck-owning Republicans. But it’s also backed by research. According to a new paper by out of the Stanford AI lab by researchers who were not affiliated with Google (except for coauthor Li Fei-Fei, who currently works for the company), there is an 88% chance that a neighborhood voted Democratic if its Google Street View images show more sedans than trucks. Similarly, if Street View shows more trucks than sedans, there’s an 82% chance the area voted Republican.
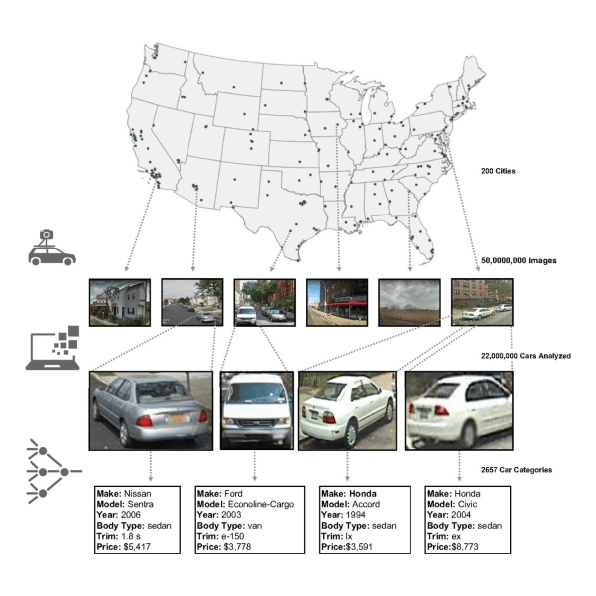
The research, published by Proceedings of the National Academy of Sciences (PNAS), reveals a new methodology for measuring demographic data. Typically, the federal government completes country-wide surveys to create a large, public data set. The most famous of these surveys is the census, which occurs every 10 years, but there are others as well, like the American Community Survey, or ACS. This survey costs about $250 million per year for the Census Bureau to complete and provides information like income, race, education levels, and employment, and can often lag behind reality because it takes so long to complete each survey. But this new method uses 50 million Google Street View images to train algorithms on how to recognize different demographic factors based purely on neighborhood street scenes. The researchers write that this is a much less expensive means of gathering demographic data that could be updated more frequently. Because the U.S. spends more than $1 billion every year on programs like the ACS, this new method would certainly be less expensive–but there’s a limit to using algorithms to discern attributes like race and income based purely on pictures.While the paper’s most striking example uses types of cars as a proxy for an area’s political tendencies, the researchers say that by using an algorithm to determine the make, model, and year of 22 million vehicles found in the Street View images and then training it using demographic and voting data from the ACS, U.S. Census and 2008 presidential elections, they could also accurately predict income, race, and education in 200 cities across the U.S.
For instance, the researchers found that people of Asian descent were more likely to drive Asian-made cars, while black people tended to drive cars made by Chrysler, Buick, and Oldsmobile. Pickup trucks, Volkswagens, and Aston Martins indicate a largely white neighborhood.
![]()
–– ADVERTISEMENT ––


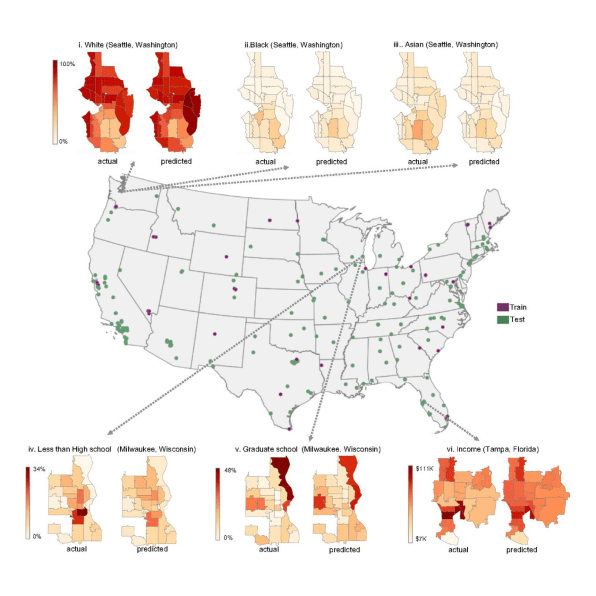
Finding these trends helped the researchers’ algorithms predict race and education. To illustrate their findings, the researchers took a more granular look at a few cities: They predicted the percentages of black, white, and Asian people in different Seattle neighborhoods as well as the percentages of people with less than a high school degree, and those with high school diplomas, bachelor’s degrees, and graduate degrees in Milwaukee. A visualization that maps actual demographic information from the ACS side by side with the predicted demographic information reveals how accurate it is at a glance.The researchers chose cars as a proxy to determine demographic data for a few reasons, according to the paper’s lead author, Timnit Gebru. She says that differentiating between the models, makes, and years of cars is a difficult computer vision problem because the objects look so similar, making it an exciting research question. But cars also intuitively make sense as a proxy for things like income–they’re an obvious symbol of people’s consumption patterns. Not to mention that 90% of Americans own one. “In addition, I think cars are the most dynamic objects that tell us about demographics,” Gebru tells Co.Design in an email. “The houses in a neighborhood can look the same from year to year but the cars can change.”
Of course, cars don’t predict everything–the model is not accurate when predicting the number of children in a neighborhood, and couldn’t predict the percentage of farmers at all. That might be because the study only looked at cities, including the two largest cities in each state, followed by the next 100 most populous cities in the country.
The researchers write in the paper that the method could be strengthened by combining the Street View algorithm with other data sets, like from satellite imagery or social networks. And with self-driving cars on the horizon, all of which will be equipped with multiple cameras so that the vehicle can navigate through the world, there will be a significant increase in the sheer number of images taken of our streets–which could also be put to use in creating demographic data.
Of course, there’s also a privacy question here–while the research paper only could predict down to the precinct level of about 1,000 people, a more pervasive algorithm could theoretically identify people individually based on the external trappings of their life. And who would want the government to make assumptions about who you are based on what you do and how you act in public without your permission, or without giving you a chance to correct their predictions if they happen to be wrong? The researchers breeze past this note, instead pointing to the benefits of having access to frequently updated demographic data, including that it could help policymakers foresee trends sooner than whenever the next census happens to be.
Gebru says that a method like this couldn’t replace the meticulous census process, which relies on self-reported data and has a tried-and-true methodology. Any algorithm that uses data to make broad, sweeping predictions is inherently flawed because it does not take into account the outliers–something Gebru acknowledges. After completing her PhD at Stanford earlier this year, she started working as a postdoctoral researcherat Microsoft’s Fairness Accountability Transparency and Ethics group. She’s working on the problem of bias in large-scale data mining projects.
Using the Street View method for official public data may not be in the public’s best interest because of accuracy and privacy issues, but it could make studying other elements of cities easier, such as the link between the amount of green space in a neighborhood and its residents’ health–something researchers are already starting to tackle.
Original article here: https://www.fastcodesign.com/90154867/is-google-street-view-the-next-big-census-tool
A similar article here: https://www.nytimes.com/2017/12/31/technology/google-images-voters.html