In the last couple of days we’ve had lots of great conversations here in Pointnineland about the past, present, and future of SaaS. These discussions were triggered, among other things, by:
- Clément’s most recent Medium post, in which he asks if we’re past the Golden Age of SaaS investing.
- This TechCrunch article about the implosion of early-stage VC funding (across several sectors, including SaaS).
- Our thinking that while rumors of the death of SaaS are greatly exaggerated (as they were in 2015 or 2010), most future SaaS winners won’t be built using the playbook of the past. Specifically, I’m convinced that AI will be the biggest value driver in software in the next decade, which has lots of implications on the right way to build (and fund) B2B software companies.
Our discussions prompted me to dig into Crunchbase for data on SaaS funding rounds in the last ten years. The data quality isn’t perfect (see the small print at the very bottom for some caveats) but it should be good enough for identifying the major trends in SaaS financing in the last years.
1. Seed investments from 2008–2017
Let’s start with (a) the number of SaaS seed investment rounds and (b) the total amount invested in these rounds in the 2008–2017 period:
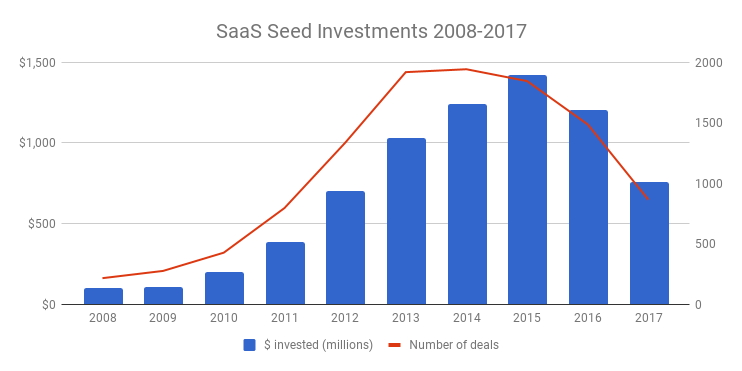
As you can see, after an explosion in SaaS seed funding from 2008 to 2015, which was fuelled by the rise of institutional seed financing and a strong acceleration in SaaS adoption, SaaS seed funding has indeed dropped sharply in the last two years: Both the number of deals and dollar amounts have approximately halved after peaking in 2014 and 2015, respectively. It might be worth pointing out that even though we’re now back to 2011/2012 levels, the numbers are still 4–7x higher compared to 2008 (depending on whether you look at the number of deals or dollar amounts). In 2018 we’ll find out if the 2016/2017 drop was just a correction following an excessive amount of seed funding in 2013–2015 or if the decline will continue.
Next, let’s take a look at how the average size of a SaaS seed round has evolved in the last ten years:
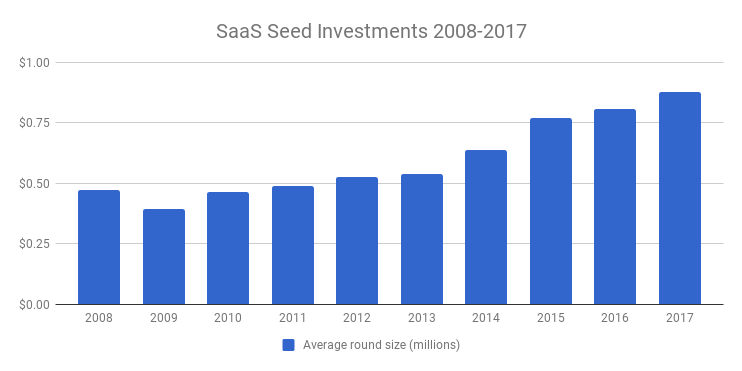
I don’t know about you, but to me, this chart was a surprise. I would have thought that the average round size has gone up much more sharply in the last years. I have some concerns regarding the data quality (for example, how reliable the Crunchbase data is for seed stage convertible loans, which have become much more popular over the last years), but it’s pretty clear that $2–3M seed rounds are still rare outliers, while the majority of seed rounds are significantly sub $1M.
2. Series A-D
Next up is the same data for Series As, Bs, Cs and Ds:
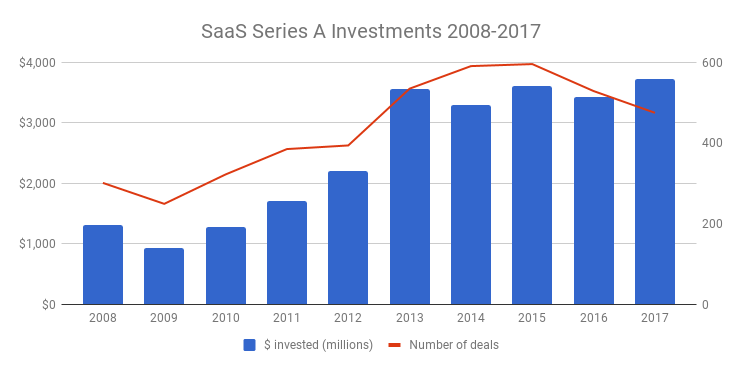
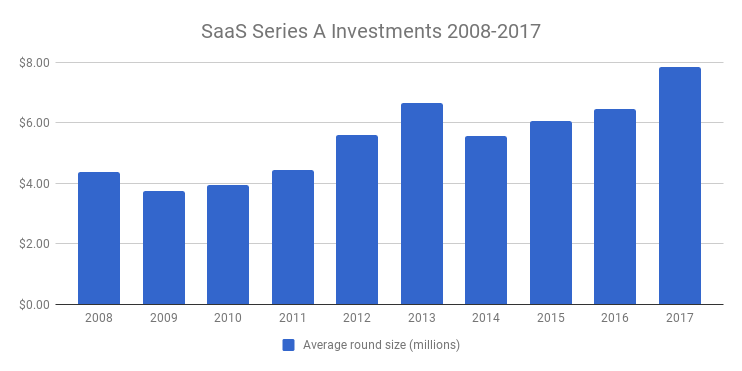
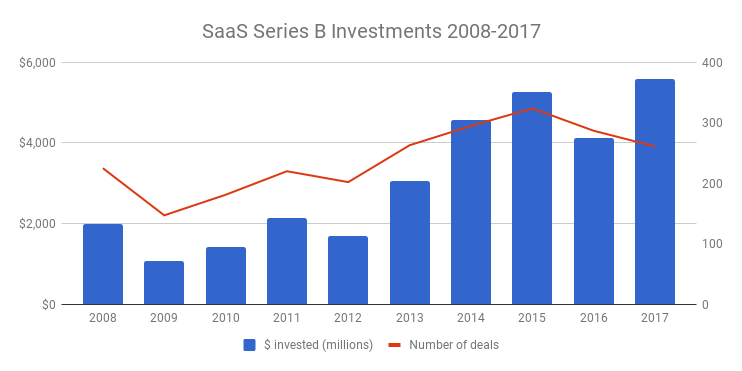
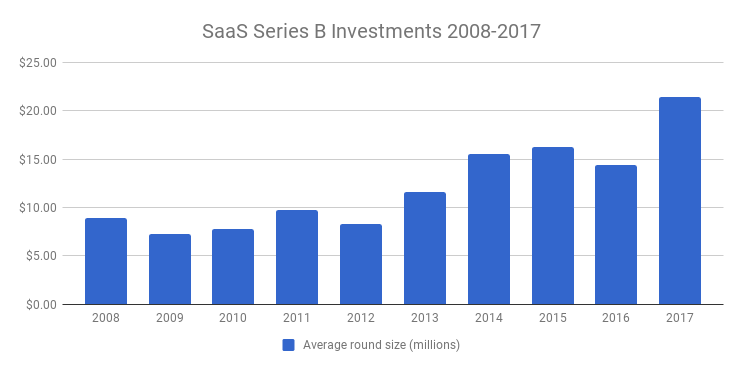
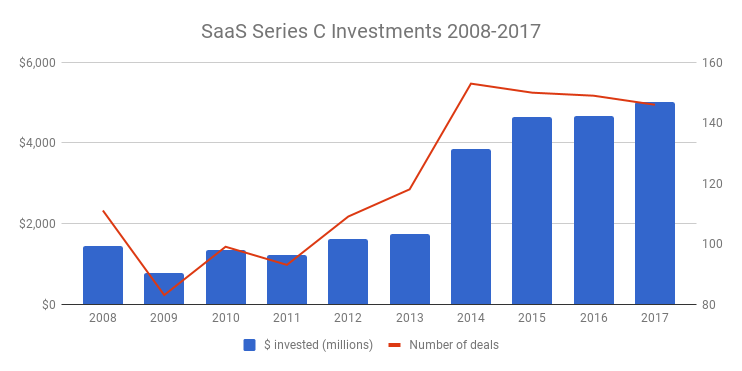
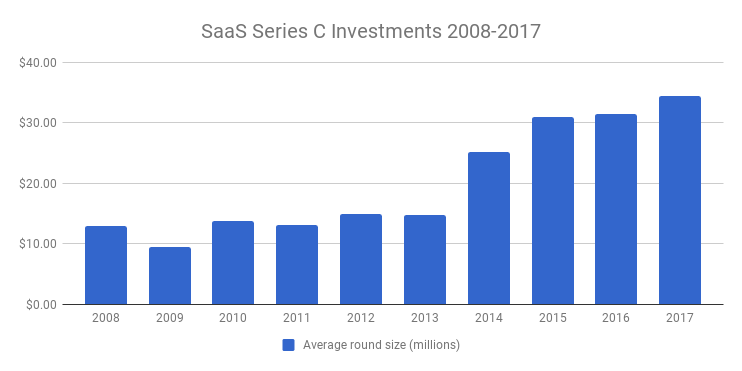
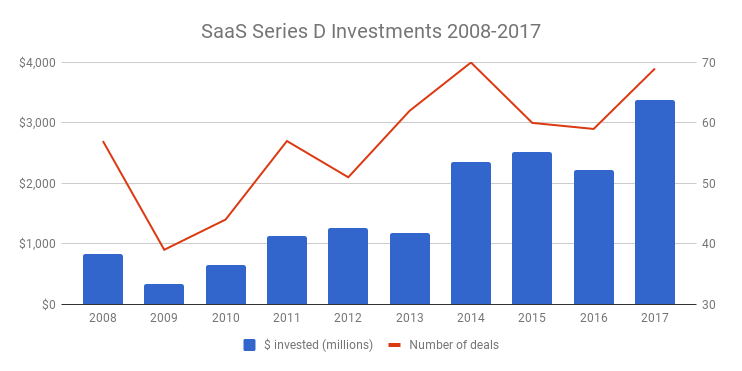
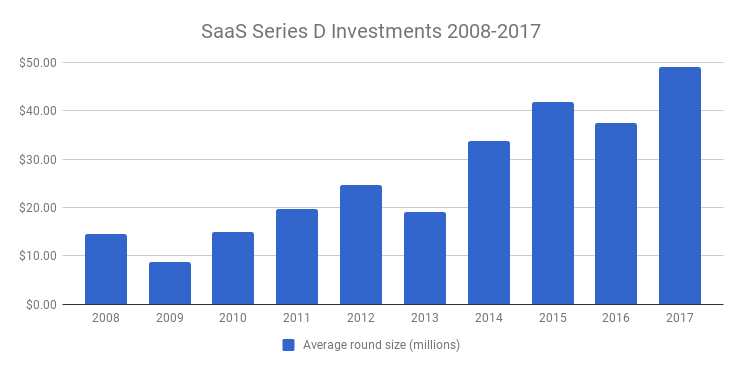
Looking at these charts we can observe a couple of things:
- The funding drop in 2016/2017 really is limited to the seed stage. The number of Series A investments went down a little since 2015, but not nearly as much as the number of seed investments, and the dollar amounts have not decreased at all. Indeed, 2017 has been a new record year in terms of the dollar amount invested in Series A, B, and C as well as D rounds!
- From 2008 to 2017, the average round size has increased by ca. 1.8x for Series As, ca. 2.4x for Series Bs, ca. 2.7x for Series Cs, and a whopping 3.4x for Series Ds. The data is less reliable for Series Cs and Series Ds because there are much fewer deals in these categories, so a few outliers can have a larger impact on the averages. Also, the data might include some companies that you wouldn’t really consider to be B2B SaaS (more on that in the footnotes). But the take-away is clear: The average round size has gone up much more strongly for later stages than for earlier stages. This isn’t surprising, since the supply of late-stage financing in the market has grown much faster than the number of companies that make it to the Series D stage. If a company looks like the next unicorn (or even a decacorn), everybody wants to pile in.
3. Seed-Series D, 2008–2017
Here’s another way to look at the data, combining the numbers for all stages in one chart:
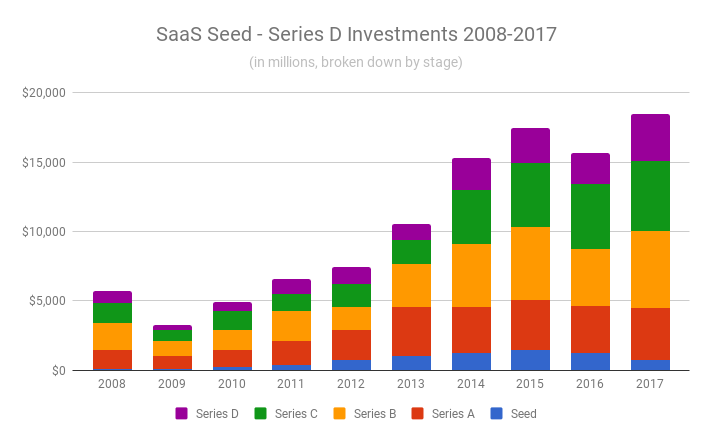
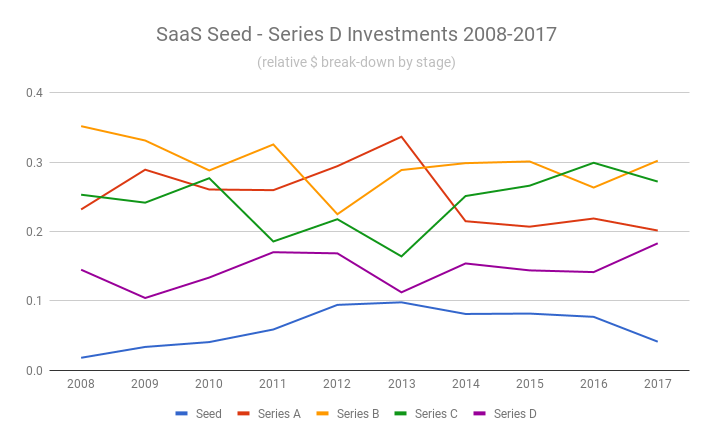
Again, what stands out is that while seed investments have peaked in 2015 and declined in the last two years, Series-A-and-up investments have continued to grow in the last years. As a result, only 4% of the total amount invested into SaaS went into seed rounds in 2017. In 2013 that percentage was close to 10%.
4. Geographic break-down
One question I had was whether the growth in SaaS funding could have been driven by increased investment activity in developing countries and if, maybe, there was a decline in Series A-D investing in North America and Europe, offset by growth in the rest of the world? Let’s look at the data:
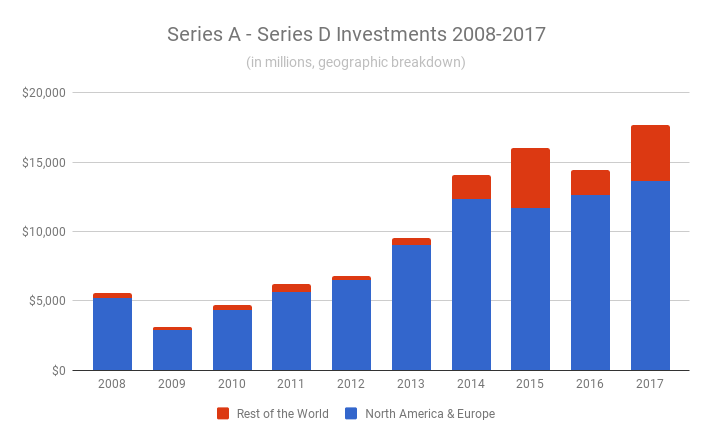
As you can see, SaaS investments outside of North America and Europe have indeed grown dramatically, especially in the last years, and now account for a much larger share than 10 years ago. However, if you look at the blue bars only, you can see that investments in North America and Europe have grown, too.
5. How have graduation rates developed over time?
Last but not least I wanted to take a look at the graduation rate, i.e. the percentage of startups that make it to the next round. To get an estimate for this number I assumed that, on average, it takes a startup 18 months to go from one stage to the next. Therefore I looked at how many companies have raised a seed round between July 2007 and December 2008, between January 2009 and June 2010, between July 2010 and December 2011, and so on, and did the same for Series As, Bs, Cs, and Ds. I then calculated the graduation rate by dividing the number of companies that have raised a seed round in one 18-month-period by the number of companies that have raised a Series A round in the following 18-month-period, and so on.
It’s important to note that this is a rough approximation because the assumption that companies move to the next stage after 18 months is highly simplistic. To get a more reliable answer to the graduation question we’ll have to go through all seed companies and check how many of them actually raised a Series A and do the same for other stages. This is probably possible with Crunchbase data but hey, it’s a Saturday evening, so please bear with me. 🙂
With this caveat in mind, here’s the chart:
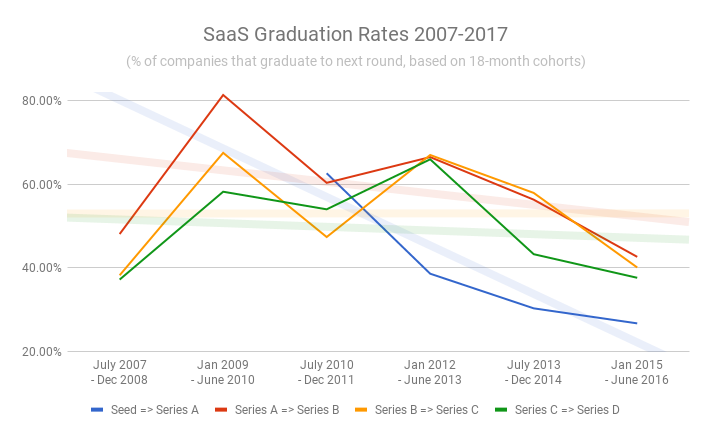
Given the ca. 9x increase of the number of seed rounds from 2008 to 2014, it’s not surprising that the graduation from seed to Series A has plummeted. Series A investors have kept the bar high, so while — according to this estimate — ca. 39% of the companies that raised a seed round between January 2012 and June 2013 went on to raise a Series A, only ca. 27% of the companies from the January 2015-June 2016 seed cohort went to the next stage.
Graduation from Series A to B, B to C, and C to D has decreased as well in the last years. Since, as we saw above, total funding dollars have increased across all these stages, this again suggests a trend towards more and more concentration. In other words, fewer and fewer companies make it to the next stage, but those that do, raise bigger and bigger rounds.
6. SaaS financing, quo vadis?
It will be very interesting to see if the decline in seed financing in 2016–2017 will lead to a slowdown of Series A rounds in 2018. It sounds obvious, because the number of companies that have raised a seed in 2016–2017 and are up for a Series A will be much smaller than the number of potential Series A candidates in previous years. Then again, there are lots of companies that need more time to get from seed to A, so who knows how many companies that were started several years ago will become ready for an A round next year.
The bigger question is if SaaS, as a category, has seen its peak. I won’t try to answer this question in this post, but I’m sure my colleagues and I will address it in future posts.
Notes:
- As I’ve noticed that a lot of SaaS companies in the Crunchbase data don’t have the “SaaS” tag, I’ve included all companies from the following categories: SaaS, Software, Enterprise Software, and Cloud Computing. This very likely means that a number of companies that shouldn’t be included in the analysis have slipped in. On the other hand, it’s also well possible that there are companies that should have been included which haven’t tagged correctly on Crunchbase. I’m hoping that these two errors more or less cancel each other out. 🙂
- I didn’t systematically check out all companies to see if they look like SaaS companies. In a few cases, though, I stumbled on large financing rounds of companies that clearly aren’t B2B SaaS, and in these cases I removed the respective data from the analysis. Companies that I’ve removed include Spotify, Magic Leap, GoPro, and Wish.
- In the graduation chart, I’m not showing the data for the seed to Series A conversion of the first two cohorts because that data looked odd. For one of these cohorts, the graduation rate was at above 100%, which probably means that a larger number of older companies raised a Series A in the respective 18-month-period. As mentioned above, I’ve used a highly simplistic approach to get a rough estimate of graduation rates and a deeper look is needed to get a more reliable analysis.